The phrase "curve the exam" can describe several different policies. A calculator cannot predict the adjusted score until the instructor identifies the method.
Additive curve
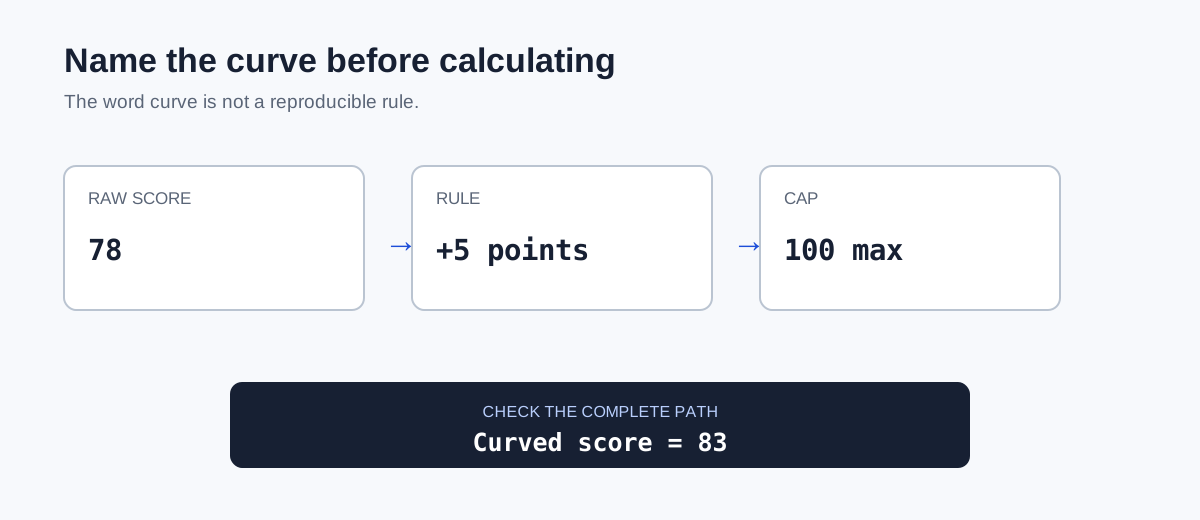
The same number of points is added to every raw score, often with a maximum of 100.
Rescale the highest score to 100
One rescaling method divides each raw score by the highest score and multiplies by 100. If the highest score is 92, a raw 78 becomes:
Change letter-grade cutoffs
An instructor can leave numeric scores unchanged and lower the thresholds for A, B, C, and other grades. In that case, the curved letter changes while the percentage shown may stay at 78.
Distribution-based curves
Some courses assign target proportions of letter grades or use statistical measures. These methods require the full class distribution, not only one student's score. For example, Loyola University Chicago School of Law publishes a distribution curve for certain course sizes, illustrating that a formal curve can control grade proportions rather than add points.
How do curve methods change the same score?
For a raw 78, adding five points gives 83, while scaling against a highest score of 92 gives 84.78. Lowering the B cutoff to 78 could instead change only the letter. Showing these side by side prevents the word "curve" from hiding the rule that produced the outcome.
If the class uses a distribution, an individual score is insufficient. You would need at least the full score set or the instructor's published grade proportions and tie-handling policy.
Do not promise a curve
Class averages and rumors do not establish the instructor's rule. Use a provisional scenario and label the method, cap, and assumed highest score.
How can you describe a curve as a reproducible rule?
Replace the word “curve” with an equation or cutoff table. “Add five points to every score,” “divide by the highest score and multiply by 100,” and “lower the B cutoff to 78” are three different policies. Record whether the rule applies to one exam, one assignment category, or the final course grade.
Test the rule with at least two raw scores, including one near a letter-grade boundary. An additive curve changes every score by the same number of points; a rescaling curve changes lower and higher scores by different amounts. A cutoff change may alter the letter grade without changing the percentage at all. These checks reveal what the policy actually does before a student treats a rumored curve as a forecast.
Use the instructor's published result
Only the course staff can confirm whether a curve will be applied and how ties, caps, or score floors are handled.
A four-pass check for this method
A reliable grade curve calculation estimate should leave an audit trail, not just a final number. Work through these four passes in order and keep the source for every scale, weight, credit value, and inclusion decision beside the calculation.
- Write the curve as an equation or a revised cutoff table.
- Apply the rule to the original score without changing other inputs.
- Test a second score near a grade boundary for consistency.
- Use the instructor’s published curved result for official decisions.
After the four passes, change one input at a time and calculate again. The direction and size of the change should match the rule you documented. Preserve unrounded values until the final display, label hypothetical inputs, and keep institutional results separate from estimates created for planning. If the worksheet still disagrees with an official record, compare the included courses and denominator before assuming the arithmetic is wrong.
Apply the stated curve to a low, middle, and boundary score. A rule that cannot reproduce all three outcomes is incomplete or has an unstated cap, floor, or cutoff change. Save the source date with the worksheet so a later policy change does not silently alter the meaning of the estimate.
Sources
Apply the instructor’s curve to the affected scores first. Then enter the adjusted category averages in the grade calculator with weights so the curve is not counted twice.