Exam labels do not determine the math. The syllabus weights do. A midterm worth 20 percent and a final worth 30 percent must be combined with the other 50 percent of the course.
Formula
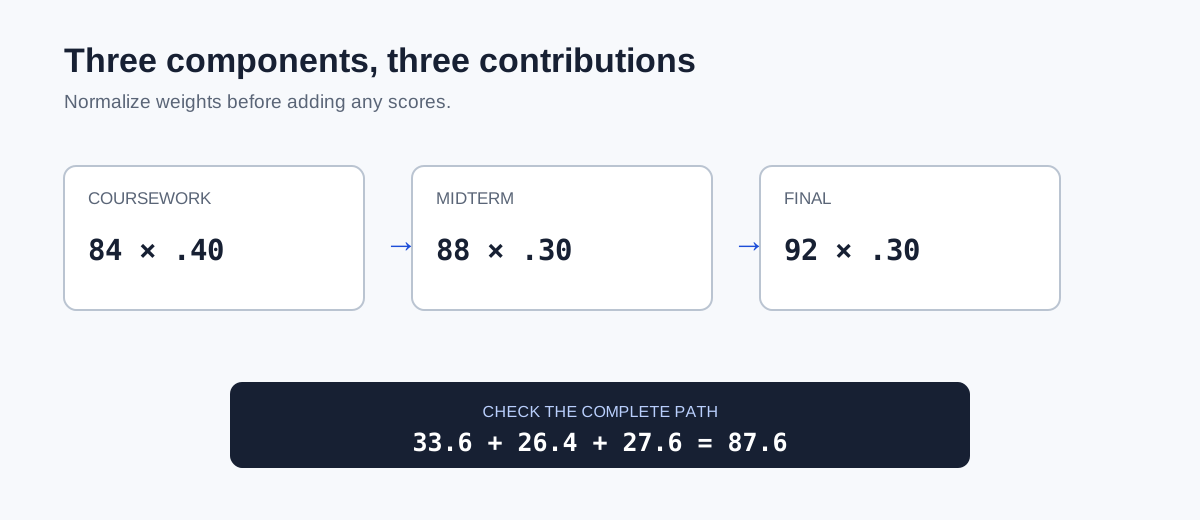
Worked example
| Component | Score | Weight | Contribution |
|---|---|---|---|
| Coursework | 78 | 50% | 39.00 |
| Midterm | 85 | 20% | 17.00 |
| Final | 90 | 30% | 27.00 |
| Total | 100% | 83.00 |
Why should you normalize exam weights?
Some syllabi list several coursework categories plus separate exams. Copy every category and verify that the weights total 100 percent. If the listed weights total 90 or 110, do not silently rescale them; first check for a missing category, an optional assignment, or a typographical error.
When the gradebook shows only completed work, you may need two results. The grade so far divides earned contributions by the completed weight. The projected course grade includes assumed scores for the unfinished midterm, final, project, or participation category.
Compare final-exam scenarios
| Final score | Final contribution | Projected course grade |
|---|---|---|
| 70 | 21.00 | 77.00 |
| 80 | 24.00 | 80.00 |
| 90 | 27.00 | 83.00 |
| 100 | 30.00 | 86.00 |
The table keeps the 39-point coursework contribution and 17-point midterm contribution from the example fixed. It makes the leverage of the 30 percent final visible: each ten exam points changes the course grade by three points.
If your term uses two grading periods plus an exam, the semester grade calculator can model the same structure directly.
What if exams are inside a grade category?
Sometimes the midterm and final are simply two items in an exams category. In that case, calculate the category average according to its point rules, then apply the category weight once. Applying both an exam-item weight and a category weight can double-weight the exam.
Planning before the final
If the final is unknown, use the target-score formula to solve for it. Keep the actual midterm contribution fixed and solve only for the remaining final weight.
Build a useful exam scenario table
Before the final, calculate several possible scores rather than treating one number as a prediction. With a final worth 30 percent, every ten-point change on the final moves the course grade by three points. That sensitivity tells you whether the target is realistic and which remaining component has the most leverage.
Keep actual and hypothetical values visually separate. Once the final grade posts, replace the scenario with the official score and recalculate from the same weights.
Read replacement rules carefully
Some courses replace the midterm with the final when the final score is higher. That is a conditional rule, not a normal weighted average.
A four-pass check for this method
A reliable midterm final grade calculation estimate should leave an audit trail, not just a final number. Work through these four passes in order and keep the source for every scale, weight, credit value, and inclusion decision beside the calculation.
- List the current work, midterm, and final as separate components.
- Convert all published weights to decimals that total 1.00.
- Multiply each score by its own weight.
- Add contributions once and test realistic final-exam scenarios.
After the four passes, change one input at a time and calculate again. The direction and size of the change should match the rule you documented. Preserve unrounded values until the final display, label hypothetical inputs, and keep institutional results separate from estimates created for planning. If the worksheet still disagrees with an official record, compare the included courses and denominator before assuming the arithmetic is wrong.
Set the final score to 0 and 100 to find the reachable range. A target outside those bounds cannot be reached through the final under the stated weights. Save the source date with the worksheet so a later policy change does not silently alter the meaning of the estimate.