A percentage and a GPA measure are related through a grading policy, not through one national formula. A 90 percent can be an A at one school and an A- at another. Some institutions do not convert percentages at all.
The defensible method
- Find the official percentage-to-letter table.
- Convert each final course percentage to its letter grade.
- Convert that letter grade to the school's grade points.
- Weight the points by course credits.
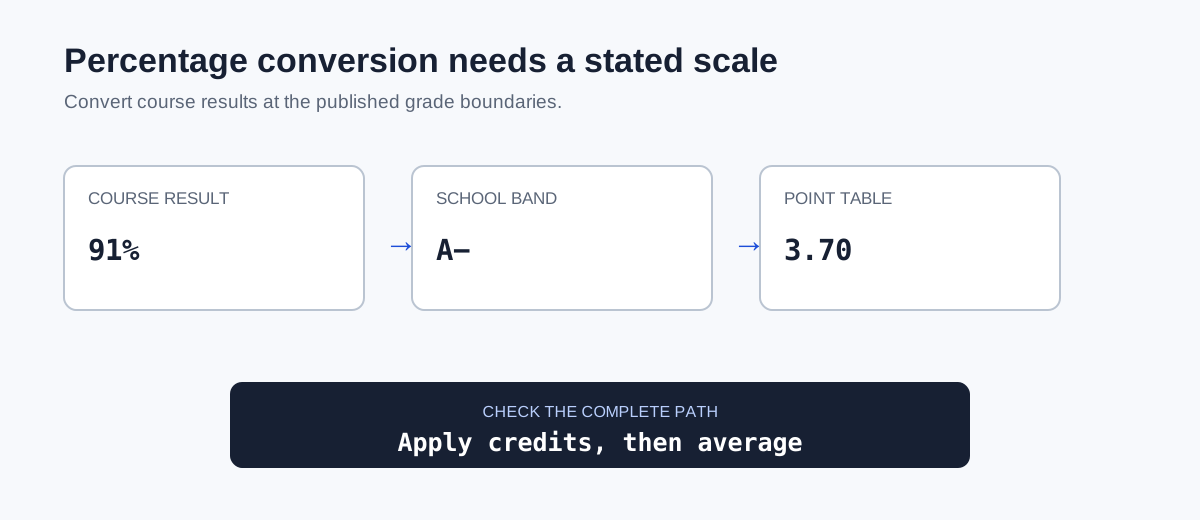
Example using one stated scale
Assume this example scale: 93 to 100 = A = 4.0, 90 to 92 = A- = 3.7, 87 to 89 = B+ = 3.3, and 83 to 86 = B = 3.0.
| Course | Percent | Letter | Points | Credits |
|---|---|---|---|---|
| English | 91% | A- | 3.7 | 1 |
| Biology | 88% | B+ | 3.3 | 1 |
| History | 94% | A | 4.0 | 1 |
Why should you avoid converting an overall percentage blindly?
Converting one combined percentage can produce a different result from converting each course. GPA is usually course-based. A 92 in one class and an 84 in another may map to 3.7 and 3.0, even though their simple percentage average is 88.
How do international and application conversions differ?
Do not use a US online table to rewrite an international transcript. Admissions offices and credential evaluators may have their own procedures. Enter grades as instructed by the receiving organization.
Pay attention to grade-band boundaries
Percentage conversion is discontinuous. Under the example scale, 89 maps to B+ at 3.3 while 90 maps to A- at 3.7. Dividing a percentage by a constant cannot reproduce that jump. This is why a linear shortcut such as percentage divided by 25 is not a defensible school GPA method.
When a final percentage contains decimals, apply the school's rounding rule before choosing the letter band. Do not round both the course percentage and the final GPA repeatedly.
Label the scale with the result
A useful estimate should say which percentage bands and GPA values were used. A bare result such as "91% equals 3.7" hides the most important assumption.
A four-pass check for this method
A reliable percentage to gpa estimate should leave an audit trail, not just a final number. Work through these four passes in order and keep the source for every scale, weight, credit value, and inclusion decision beside the calculation.
- Find the scale published by the school or receiving organization.
- Convert each final course percentage to its letter or point band.
- Apply course credits before combining results.
- Keep the scale name and boundary rule with the reported estimate.
After the four passes, change one input at a time and calculate again. The direction and size of the change should match the rule you documented. Preserve unrounded values until the final display, label hypothetical inputs, and keep institutional results separate from estimates created for planning. If the worksheet still disagrees with an official record, compare the included courses and denominator before assuming the arithmetic is wrong.
Test percentages immediately above and below a published grade boundary. This exposes the scale’s cutoff and rounding behavior before many course results are combined. Save the source date with the worksheet so a later policy change does not silently alter the meaning of the estimate.
Sources
If your school officially converts the percentages to letter grades on the scale shown here, enter those letters and credits in the high school GPA calculator. Do not invent a conversion when the transcript policy uses a different table.